

NexGold Initiates a 25,000-metre Infill Diamond Drill Program at the Goliath Gold Complex, Ontario
Press Release
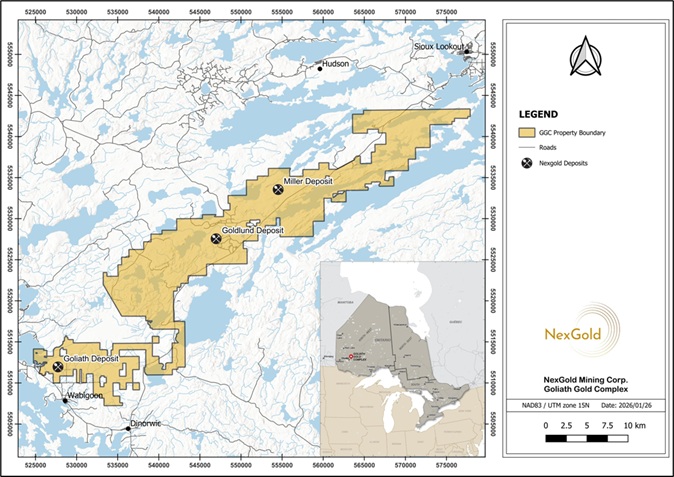
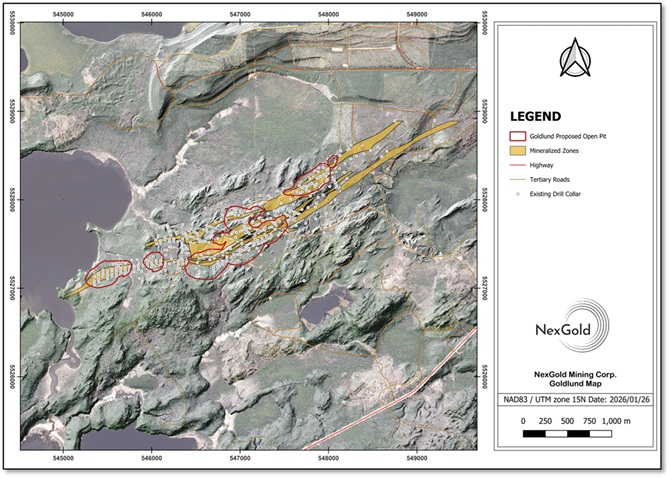
TORONTO, Jan. 28, 2026 NexGold Mining Corp. (TSXV: NEXG; OTCQX: NXGCF) (“NexGold” or the “Company”) is pleased to announce it has commenced diamond drilling at the Company’s Goliath Gold Complex in Ontario (“Goliath Complex”) (Figure 1). The drill program, which comprises up to 25,000 metres, is focused on the Goldlund Deposit and is designed to infill and potentially expand open-pit Mineral Resources (Figure 2). This drill program will primarily be focused on the deeper portions of the Goldlund open-pit Mineral Resource where the Company would like to increase drill density and further drill test high-grade plunging shoots to test their geological continuity. The drill program was initiated late in 2025 and is anticipated to continue throughout 2026.
Kevin Bullock, President and CEO, stated: “We expect 2026 will be a transformational year for NexGold as we advance towards a final investment decision at the permitted open pit Goldboro Gold Project in Nova Scotia. While that work progresses, we will continue our focus on creating value for shareholders, stakeholders and Rightsholders, which includes the opportunity to optimize the Goliath Complex in Ontario. The current drill program is consistent with project optimization and value creation, which will also include continued engagement with First Nations communities, advancement of permitting activities, as well as feasibility and other technical studies. We anticipate regular updates on the drill program throughout the year as drill results are available.”
The Goliath Complex, comprised of the Goliath, Goldlund and Miller Deposits, includes Proven & Probable Mineral Reserves of 1,267,000 ounces of gold and 1,724,000 ounces of silver (30,319,000 tonnes at a grade of 1.30 g/t gold and 1.77 g/t silver), including Probable Reserves of 621,000 ounces of gold (16,256,000 tonnes at a grade of 1.19 g/t gold) at Goldlund (Table 1). These Mineral Reserves are based on a Mineral Resource Estimate that includes 1,784,500 ounces of gold and 2,819,100 ounces of silver in combined Measured and Indicated open-pit Mineral Resources (64,769,000 tonnes grading 0.86 g/t gold and 2.99 g/t silver), including the Goldlund Deposit hosting 911,000 ounces of gold in Measured and Indicated open-pit Mineral Resources (33,353,000 tonnes at 0.85 g/t gold) (Tables 2-5). In addition, the Goldlund open-pit includes an Inferred Mineral Resource of 680,200 ounces of gold (28,833,000 tonnes grading 0.73 g/t gold) (Table 4).
The Goliath Complex Mineral Reserves and Mineral Resource Estimate was published in a technical report entitled “Goliath Gold Complex – NI 43-101 Technical Report and Prefeasibility Study” dated March 27, 2023 (with an effective date of February 22, 2023) and was prepared by Ausenco Engineering Canada Inc. The technical report is available under the Company’s profile on SEDAR+ at www.sedarplus.ca and on the Company’s website at www.NexGold.com.
Figure 1. Map showing the Goliath Complex in northwestern Ontario
and the location of the Goldlund Deposit.
Figure 2. Map showing the proposed open pits and associated Mineral Reserve
at the Goldlund Deposit, which includes the areas of drilling planned for 2026.
Table 1: Goliath Gold Complex Mineral Reserve
| Classification | Quantity (kt) |
Au (g/t) |
Au (koz) |
Ag (g/t) |
Ag (koz) |
| Open Pit – Goliath | |||||
| Proven | 3,969 | 1.05 | 134 | 3.22 | 410 |
| Probable | 5,580 | 0.67 | 119 | 2.20 | 395 |
| Proven & Probable | 9,549 | 0.83 | 254 | 2.62 | 805 |
| Open Pit – Goldlund | |||||
| Proven | – | – | – | – | – |
| Probable | 16,256 | 1.19 | 621 | – | – |
| Proven & Probable | 16,256 | 1.19 | 621 | – | – |
| Open Pit – Miller | |||||
| Proven | – | – | – | – | – |
| Probable | 738 | 1.03 | 24 | – | – |
| Proven & Probable | 738 | 1.03 | 24 | – | – |
| Underground – Goliath | |||||
| Proven | 596 | 3.96 | 76 | 16.73 | 321 |
| Probable | 3,180 | 2.85 | 292 | 5.85 | 598 |
| Proven & Probable | 3,776 | 3.03 | 368 | 7.56 | 918 |
| Total | |||||
| Proven | 4,565 | 1.43 | 210 | 4.98 | 731 |
| Probable | 25,754 | 1.28 | 1,057 | 1.20 | 993 |
| Proven & Probable | 30,319 | 1.30 | 1,267 | 1.77 | 1,724 |
Notes: 1. Mineral reserves with an effective date of December 31, 2022 are founded on and included within the mineral resource estimates, with an effective date of January 17, 2022. 2. Mineral reserves were developed in accordance with CIM Definition Standards (2014). 3. Open pit mineral reserves incorporate 10%, 7% and 9% dilution for Goliath, Goldlund and Miller, respectively. Open pit mineral reserves include 1% loss for Goliath and Miller, no losses are included for Goldlund. Goliath underground mineral reserves include 5% dilution and 0% loss for development. For stopes at Goliath underground, the mineral reserves include 15% dilution (both downhole and uphole stopes) and 90% (downhole) and 80% (uphole) recovery. 4. Open pit mineral reserves are reported based on open pit mining within designed pits above cut-off values of C$15.22/t, C$16.00/t and C$23.63/t for Goliath, Goldlund and Miller, respectively. Goliath underground mineral reserves are reported based on underground mining within designed underground stopes above a mill feed cut-off value of C$107.66/t (inclusive of 15% mining dilution). The cut-off values are based on a gold price of US$1,550/oz Au, a silver price of US$22, transportation costs of C$5/oz Au, payabilities of 99% Au and 97% Ag, LOM average gold recoveries of 94.2% for Goliath, 94.3% for Goldlund and 94.0% for Miller, and a silver recovery of 60% for Goliath. 5. Underground mineral reserves following Year 13 have been removed from the LOM plan and thus are excluded in the mineral reserve table above. Some low grade Goldlund material above cut-off is not fed to the plant and therefore not included in the mineral reserves. 6. The Qualified Person for the open pit mineral reserve estimate is Colleen MacDougall, Peng; and the Qualified Person for the underground mineral reserve estimate is Sean Kautzman, Peng, both are SRK Consulting (Canada) Inc. employees. 7. Rounding may result in apparent summation differences between tonnes, grade and contained metal.
Table 2: Goliath Gold Complex Mineral Resource Estimate
| Goliath Gold Complex (effective January 17, 2022) | ||||||||
| Type | Classification | Cut-off11 | Tonnes | Au (g/t) | Au (Oz) | Ag (g/t)10 | Ag (Oz) | |
| Open Pit | Measured | 0.25 / 0.3 | 6,223,000 | 1.20 | 239,500 | 4.70 | 940,600 | |
| Indicated | 0.25 / 0.3 | 58,546,000 | 0.82 | 1,545,000 | 2.53 | 1,878,500 | ||
| Meas+Ind | 0.25 / 0.3 | 64,769,000 | 0.86 | 1,784,500 | 2.99 | 2,819,100 | ||
| Inferred | 0.25 / 0.3 | 32,301,000 | 0.73 | 754,900 | 0.80 | 85,200 | ||
| Underground | Measured | 2.20 | 170,000 | 6.24 | 34,100 | 22.34 | 122,100 | |
| Indicated | 2.20 | 2,772,000 | 3.59 | 320,000 | 7.08 | 580,800 | ||
| Meas+Ind | 2.20 | 2,942,000 | 3.74 | 354,100 | 8.04 | 702,900 | ||
| Inferred | 2.20 | 270,000 | 3.21 | 27,900 | 4.06 | 6,300 | ||
| Total | Measured | 6,393,000 | 1.33 | 273,600 | 5.17 | 1,062,700 | ||
| Indicated | 61,318,000 | 0.95 | 1,865,000 | 2.98 | 2,459,300 | |||
| Meas+Ind | 67,711,000 | 0.98 | 2,138,600 | 3.42 | 3,522,000 | |||
| Inferred | 32,571,000 | 0.75 | 782,800 | 0.84 | 91,500 | |||
Notes:
- Mineral Resources were estimated by ordinary kriging by Dr. Gilles Arseneau, associate consultant of SRK Consulting (Canada) Inc., Mineral Resources were prepared in accordance with NI 43-101 and the CIM Definition Standards for Mineral Resources and Mineral Reserves (2014) and the CIM Estimation of Mineral Resources and Mineral Reserves Best Practice Guidelines (2019). This estimate of Mineral Resources may be materially affected by environmental, permitting, legal, title, taxation, sociopolitical, marketing, or other relevant issues. Mineral Resources that are not mineral reserves do not have demonstrated economic viability.
- Mineral Resource effective date January 17, 2022.
- Goliath Open Pit Mineral Resources are reported within an optimized constraining shell at a cut-off grade of 0.25g/t gold that is based on a gold price of US$1,700/oz, a silver price of US$23/oz, and a gold and silver processing recovery of 93.873*Au(g/t)^0.021 and 60% respectively.
- Goldlund Open Pit Mineral Resources are reported within an optimized constraining shell at a cut-off grade of 0.3g/t gold that is based on a gold price of US$1,700/oz and a gold processing recovery of 90.344xAu(g/t)^0.0527.
- Miller Open Pit Mineral Resources are reported within an optimized constraining shell at a cut-off grade of 0.3 g/t gold that is based on a gold price of US$1,700/oz and a gold processing recovery of 93.873*Au(g/t)^0.021.
- Goliath Underground Mineral Resources are reported inside shapes generated from Deswick Mining Stope Optimiser (DSO) at a cut-off grade of 2.2g/t gold that is based on a gold price of US$1,700/oz, a silver price of US$23/oz, and a gold and silver processing recovery of 93.873*Au(g/t)^0.021 and 60% respectively.
- Goldlund Underground Mineral Resources are reported inside DSO shapes at a cut-off grade of 2.2g/t gold that is based on a gold price of US$1,700/oz and a gold processing recovery of 90.344xAu(g/t)^0.0527.
- Gold and Silver assays were capped prior to compositing based on probability plot analysis for each individual zones. Assays were composited to 1.5 m for Goliath, 2.0 m for Goldlund and 1.0 m for Miller.
- Excludes unclassified mineralization located within mined out areas.
- Silver grade and ounces are derived from the Goliath tonnage only.
- Goliath Open Pit and Goldlund/Miller cut-off grades are 0.25g/t and 0.30g/t, respectively.
- All figures are rounded to reflect the estimates’ relative accuracy, and totals may not add correctly.
Table 3: Goliath Deposit Mineral Resource Estimate1
| Goliath (effective January 17, 2022.) | |||||||
| Type | Classification | Cut-off | Tonnes | Au (g/t) | Au (Oz) | Ag (g/t) | Ag (Oz) |
| Open Pit | Measured | 0.25 | 6,223,000 | 1.20 | 239,500 | 4.70 | 940,600 |
| Indicated | 0.25 | 23,081,000 | 0.75 | 559,400 | 2.53 | 1,878,500 | |
| Meas+Ind | 0.25 | 29,304,000 | 0.85 | 798,900 | 2.99 | 2,819,100 | |
| Inferred | 0.25 | 3,330,000 | 0.66 | 70,200 | 0.80 | 85,200 | |
| Underground | Measured | 2.20 | 170,000 | 6.24 | 34,100 | 22.34 | 122,100 |
| Indicated | 2.20 | 2,550,000 | 3.55 | 291,000 | 7.08 | 580,800 | |
| Meas+Ind | 2.20 | 2,720,000 | 3.72 | 325,100 | 8.04 | 702,900 | |
| Inferred | 2.20 | 48,000 | 2.95 | 4,600 | 4.06 | 6,300 | |
| Total | Measured | 6,393,000 | 1.33 | 273,600 | 5.17 | 1,062,700 | |
| Indicated | 25,631,000 | 1.03 | 850,400 | 2.98 | 2,459,300 | ||
| Meas+Ind | 32,024,000 | 1.09 | 1,124,000 | 3.42 | 3,522,000 | ||
| Inferred | 3,378,000 | 0.69 | 74,800 | 0.84 | 91,500 | ||
- Refer to the Notes on the Mineral Resource Estimate in Table 1 of this News Release
Table 4: Goldlund Deposit Mineral Resource Estimate1
| Goldlund (effective January 17, 2022.) | |||||
| Type | Classification | Cut-off | Tonnes | Au (g/t) | Au (Oz) |
| Open Pit | Measured | 0.30 | 0 | 0.00 | 0 |
| Indicated | 0.30 | 33,353,000 | 0.85 | 911,000 | |
| Meas+Ind | 0.30 | 33,353,000 | 0.85 | 911,000 | |
| Inferred | 0.30 | 28,833,000 | 0.73 | 680,200 | |
| Underground | Measured | 2.20 | 0 | 0.00 | 0 |
| Indicated | 2.20 | 222,000 | 4.06 | 29,000 | |
| Meas+Ind | 2.20 | 222,000 | 4.06 | 29,000 | |
| Inferred | 2.20 | 222,000 | 3.26 | 23,300 | |
| Total | Measured | 0 | 0.00 | 0 | |
| Indicated | 33,575,000 | 0.87 | 940,000 | ||
| Meas+Ind | 33,575,000 | 0.87 | 940,000 | ||
| Inferred | 29,055,000 | 0.75 | 703,500 | ||
- Refer to the Notes on the Mineral Resource Estimate in Table 1 of this News Release
Table 5: Miller Deposit Mineral Resource Estimate
| Miller (effective January 17, 2022.) | |||||
| Type | Classification | Cut-off | Tonnes | Au (g/t) | Au (Oz) |
| Open Pit | Measured | 0.30 | 0 | 0 | 0 |
| Indicated | 0.30 | 2,112,000 | 1.10 | 74,600 | |
| Meas+Ind | 0.30 | 2,112,000 | 1.10 | 74,600 | |
| Inferred | 0.30 | 138,000 | 1.01 | 4,500 | |
- Refer to the Notes on the Mineral Resource Estimate in Table 1 of this News Release
Technical Disclosure and Qualified Persons
Paul McNeill, P.Geo., VP Exploration of NexGold, is considered a “Qualified Person” for the purposes of National Instrument 43-101 Standards of Disclosure for Mineral Projects and has reviewed and approved the scientific and technical disclosure contained in this news release on behalf of NexGold.
About NexGold Mining Corp.
NexGold is a gold-focused company with assets in Canada and Alaska. NexGold’s Goldboro Gold Project is located in Nova Scotia. The Goliath Gold Complex (which includes the Goliath, Goldlund and Miller deposits) is located in Northwestern Ontario. NexGold also owns several other projects throughout Canada, including the Weebigee-Sandy Lake Gold Project JV, and grassroots gold exploration property Gold Rock. In addition, NexGold holds a 100% interest in the high-grade Niblack copper-gold-zinc-silver VMS project, located adjacent to tidewater in southeast Alaska. NexGold is committed to inclusive, informed and meaningful dialogue with regional communities and Indigenous Nations throughout the life of all our projects and on all aspects, including creating sustainable economic opportunities, providing safe workplaces, enhancing social value and promoting community wellbeing.
Further details about NexGold, including the Feasibility Study for the Goldboro Gold Project and the Prefeasibility Study for the Goliath Gold Complex, are available under the Company’s issuer profile on www.sedarplus.ca and on NexGold’s website at www.nexgold.com.
Contact:
Kevin Bullock
President & CEO
(647) 388-1842
kbullock@nexgold.comOrin Baranowsky
Chief Financial Officer
(647) 697-2625
obaranowsky@nexgold.com
ILR5


